Table of Contents
Example Code for using the IV class
Import the need packages to run the test script
import numpy as np
from qetpy import IV
Let’s load the example data provided, which is from a dataset taken at SLAC for multiple devices and multiple bath temperatures.
testdata = np.load("test_iv_data.npz")
dites = testdata["dites"]
dites_err = testdata["dites_err"]
vb = testdata["vb"]
vb_err = testdata["vb_err"]
rload = testdata["rload"]
rload_err = testdata["rload_err"]
Now let’s use the IV class and calculate the IV curves
ivdata = IV(dites, dites_err, vb, vb_err, rload, rload_err, ["A","B","C"])
ivdata.calc_iv()
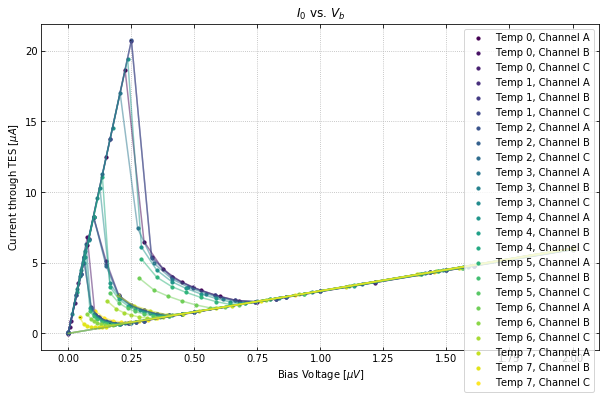
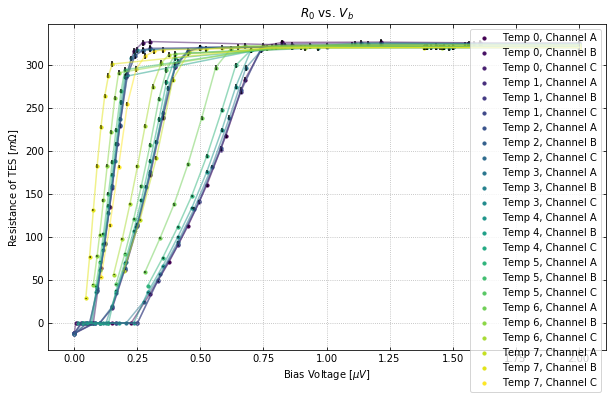
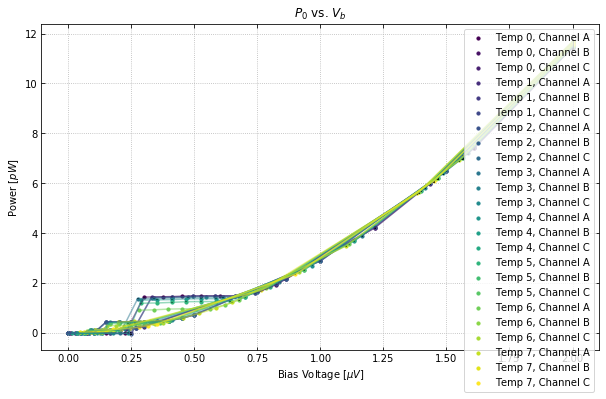
Let’s take a look at the plotting. We can plot all of the curves together.
ivdata.plot_all_curves()
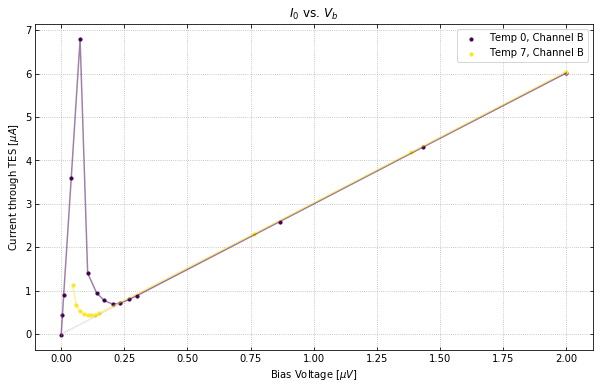
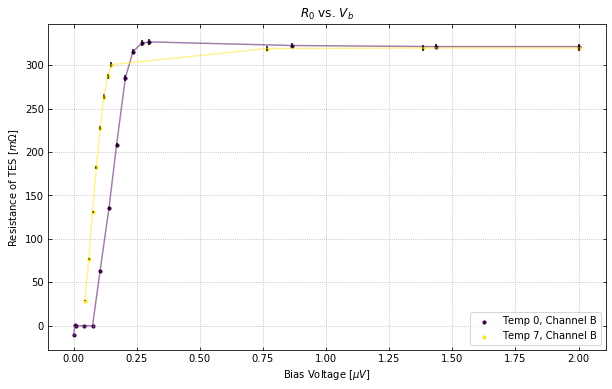
If you want to plot certain channels or certain bath temperatures, use the chans and temps flags.
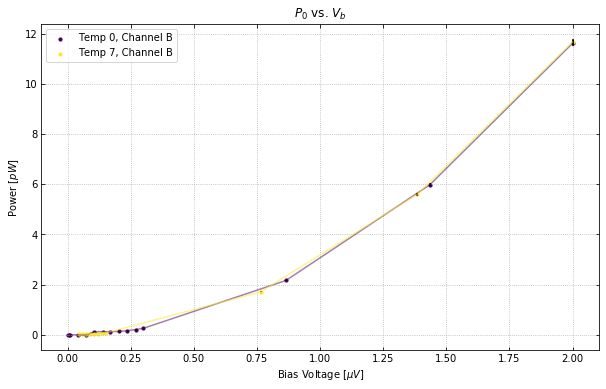
ivdata.plot_all_curves(temps=[0,7], chans=1)
We can also plot the IV, resistance, and power curves separately. See the documentation for more information on the plotting options.
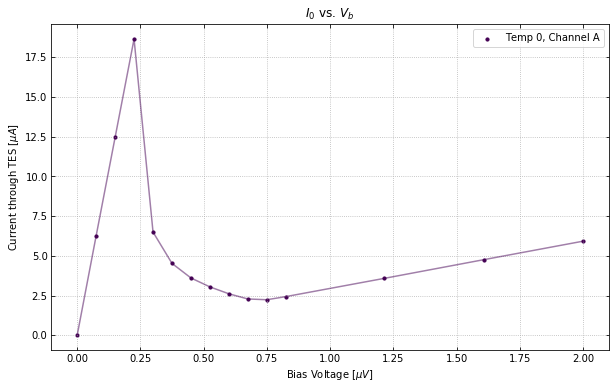
ivdata.plot_iv(temps=0, chans=0, showfit=False);
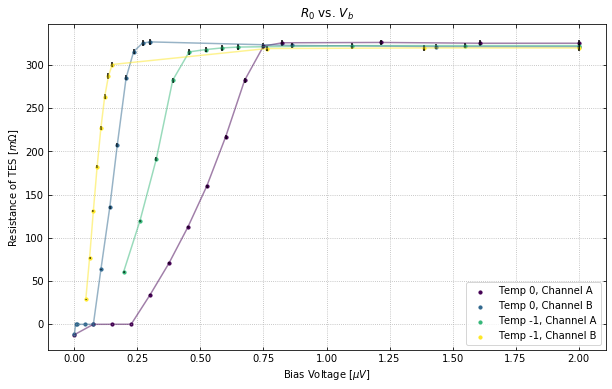
ivdata.plot_rv(temps=[0,-1], chans=[0,1]);
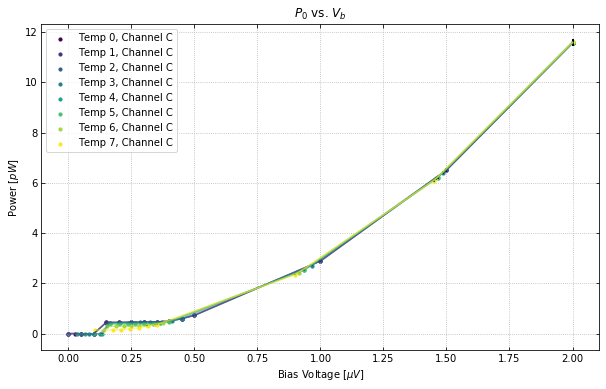
ivdata.plot_pv(temps="all", chans=2);